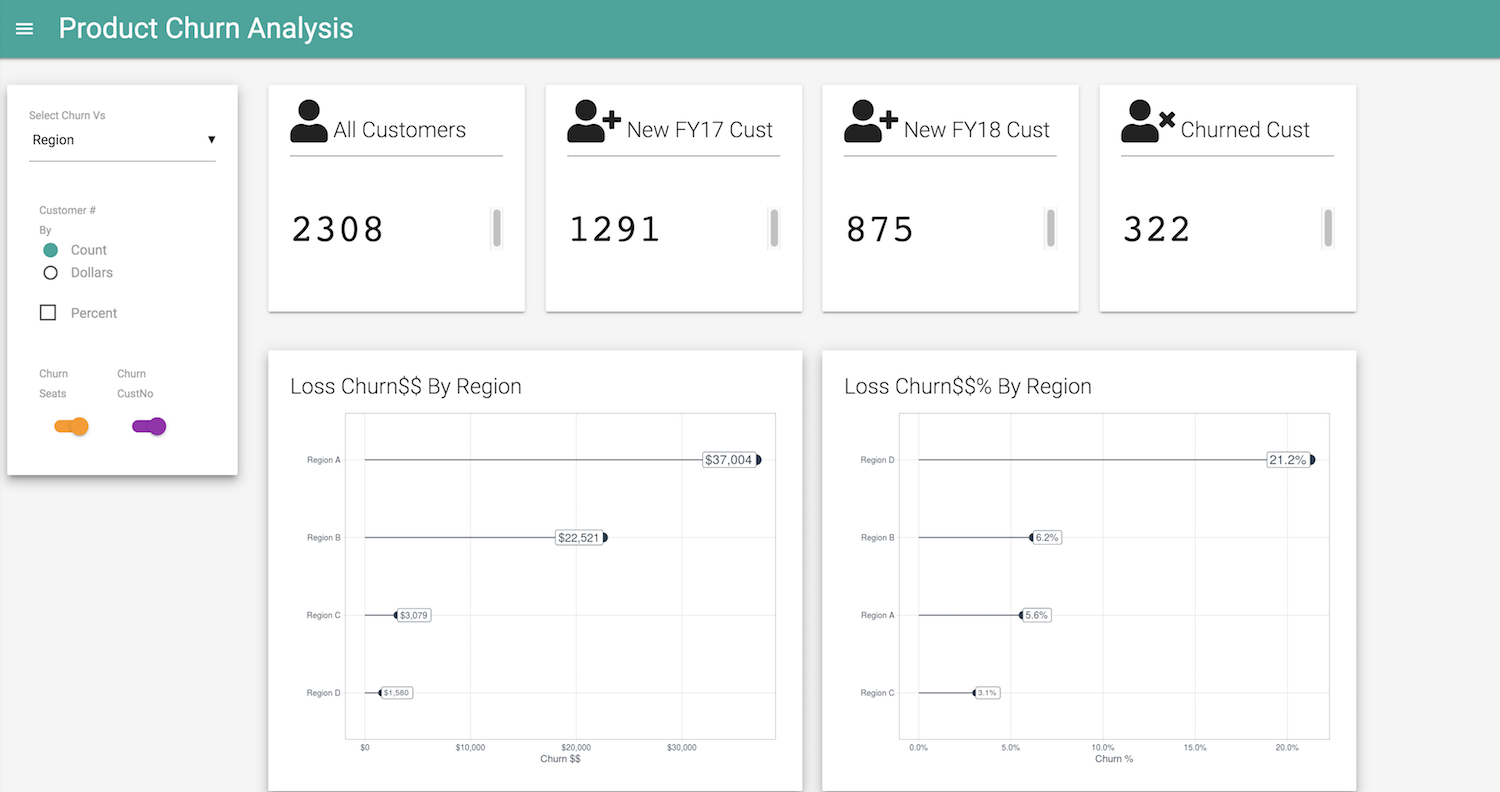
One of my goals for 2017 was to build and provide presentations as interactive products distributed and accessible to the management team as a web app. Using ShinyDashboards and highcharter: R wrapper for Highcharts for visualization, here is a starter example on shinyapps.io of one of the presentations that I would have normally created in Powerpoint. Also embedded in the post below.
Churn Predictive Analytics ShinyMaterial App