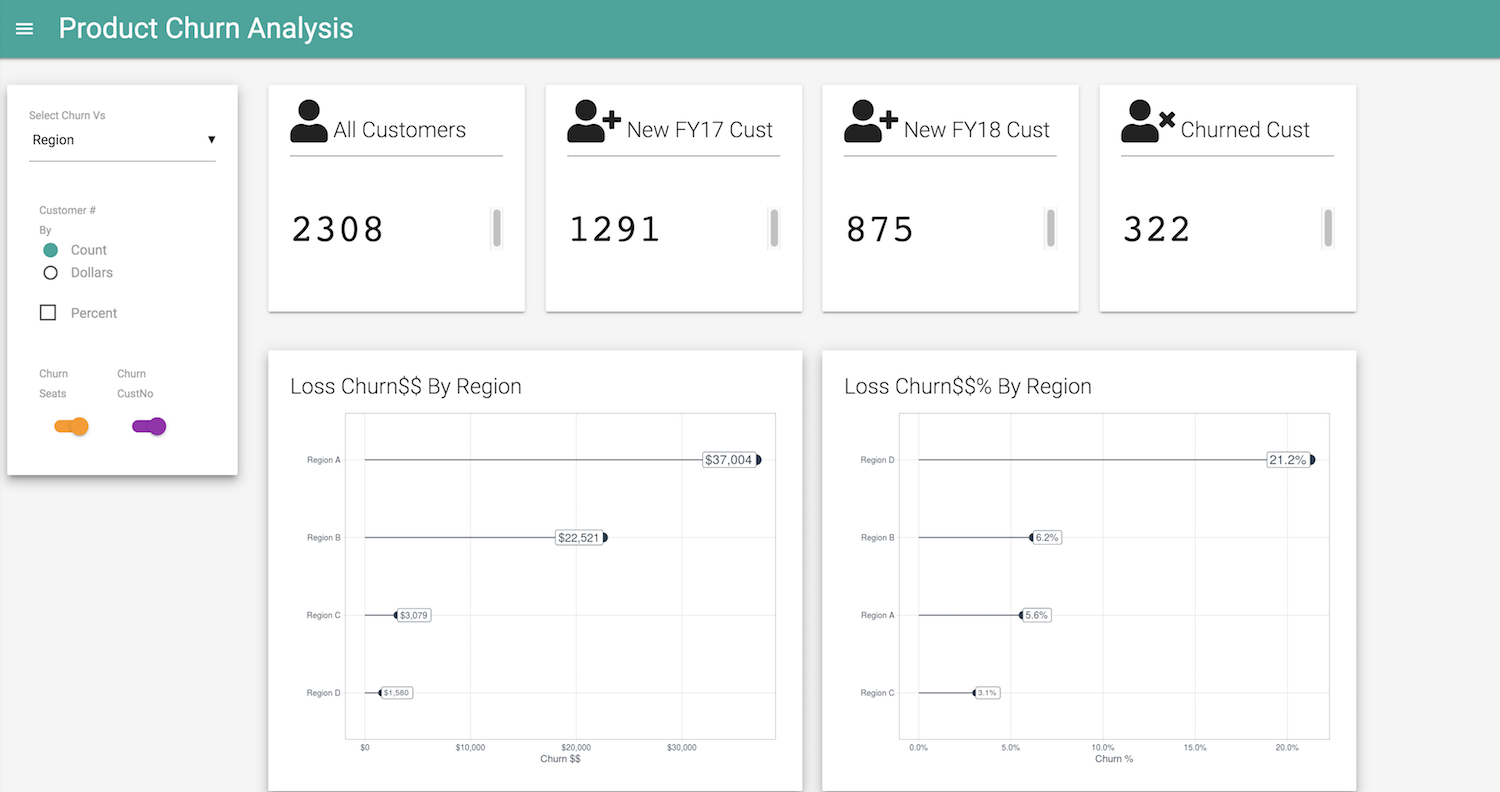

One of my goals for 2017 was to build and provide presentations as interactive products distributed and accessible to the management team as a web app. Using ShinyDashboards and highcharter: R wrapper for Highcharts for visualization, here is a starter example on shinyapps.io of one of the presentations that I would have normally created in Powerpoint. Also embedded in the post below.
Here is an example of the code for the column with drilldown chart on my dataset.
library(tidyverse)
library(highcharter)
## Warning: package 'bindrcpp' was built under R version 3.4.4View market share data
mkt_share## # A tibble: 6 x 3
## Year Vendor `Annual Rev`
## <dbl> <chr> <dbl>
## 1 2016 Other 26.0
## 2 2016 Company A 16.0
## 3 2016 Company B 8.00
## 4 2016 Company C 7.00
## 5 2016 Company E 6.00
## 6 2016 Company D 2.00other_data## # A tibble: 9 x 3
## Year Vendor `Annual Rev`
## <dbl> <chr> <dbl>
## 1 2016 Company N 3.00
## 2 2016 Company L 2.50
## 3 2016 Company J 2.00
## 4 2016 Company G 1.00
## 5 2016 Company H 1.00
## 6 2016 Company I 1.00
## 7 2016 Company M 1.00
## 8 2016 Company K 0.750
## 9 2016 Company O 0.500Prep the data for drill-down
#First data set

first_mkt_share_data <- mkt_share %>%
  mutate(name = Vendor,
         y = `Annual Rev`,
         drilldown = tolower(name)) %>%
  select(name, y, drilldown) %>%
  list_parse()

#Second data set containing drill-down content
data_for_drilled_column <- other_data %>%
  mutate(name = Vendor,
         y = `Annual Rev`,
         drilldown = tolower(name)) %>%
  select(name, y) %>%
  list_parse2() %>%
  map(function(x) {
    x[[2]] <- as.numeric(x[[2]])
    x
})

# Plot using highcharter

hc <- highchart() %>%
  hc_chart(type = "column") %>%
  hc_title(text = "2016: WW Product Market Share $M") %>%
  hc_subtitle(text = "Click 'Other' to view 'Other' Vendors") %>%
  hc_xAxis(type = "category") %>%
  hc_legend(enabled = FALSE) %>%
  hc_plotOptions(series = list(boderWidth = 0, dataLabels = list(enabled = TRUE))) %>%
  hc_add_series(name = "Mkt Share",colorByPoint = TRUE, data = first_mkt_share_data) %>%
  hc_drilldown(allowPointDrilldown = TRUE,
  series = list(list(id = "other", data = data_for_drilled_column)))

hc
Please note that Highcharts (http://highcharts.com) is a Highsoft product which is not free for commercial and Governmental use.
There are plenty of ShinyDashboards Examples with source code and Joshua Kunst who is the author of Highcharter has done an excellent job of providing examples on how to replicate highcharts demos. Thank you Joshua Kunst for all your help/responses on the highchart/highcharter visualization questions I had.
Other resources for highcharter visualizations that I found useful in creating the visuals: * Danton Noriega’s post * R documentation on highcharter package
Share this post
Twitter
Google+
Facebook
Reddit
LinkedIn
StumbleUpon
Pinterest
Email