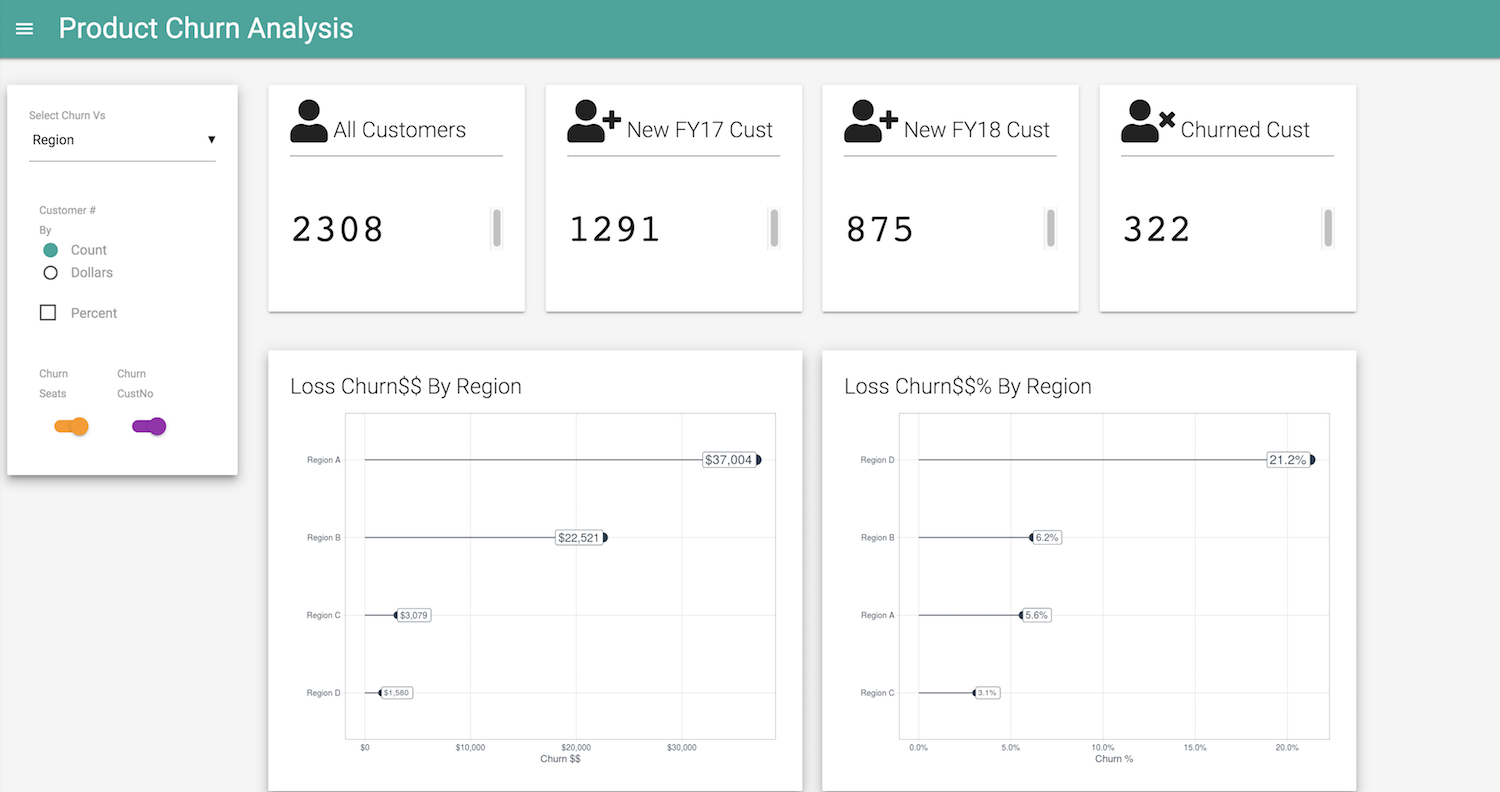
One of the business issues was to figure out a balanced distribution of the world wide and US sales force so as to maximize order dollars. This required figuring out each Product Line’s geographical strength and weaknesses in terms of Order $$ and a further drill-down on each of the top performers within the product line. Generating insights for each of the products and a summary per their Product Line meant reusing the same shiny app code for each of those products, for which shiny modules provide an efficient approach.
Many thanks to Winston Chang who sacrificed his breaks at the RStudio Shiny App training course to patiently answer and help me resolve some of the issues I had with the development of this biz dashboard. Thanks to the RStudio community member @nutterb (Benjamin) for introducing me to scoped verbs in dplyr which resolved the issue posted here.
Here is the server code that calls the module
Please note that Highcharts (http://highcharts.com) is a Highsoft product which is not free for commercial and Governmental use.
A link to a minimal example of the shiny app is provided below and also embedded in the post.
source("alt_prod_blog.R")

ui <- dashboardPage(
  # Application title ---------------------------------------------------------
  dashboardHeader(title = "Business Insights", titleWidth = 200),
  ),

  # Output: -----------------------------------------------------------------
  dashboardBody(
    # Define tabs per product
    tabsetPanel(
      id = "lic_data_set_both",
      tabPanel("ProductA", TS_module_UI("productA")),
      tabPanel("ProductB", TS_module_UI("productB")),
      tabPanel("ALL", TS_module_UI("all"))

    )
  )

server <- function(input, output) {
  x     <- reactive(input$year)
  y     <- reactive(input$y)
  prod_group <- reactive(input$prod_group)
  show_data <- reactive(input$show_data)

  callModule(
    TS_module,
    "productA",
    data = list(lic_data_set_both, mapdata, worldmapdata),
    product = "ProductA",
    prod_group,
    x,
    y,
    show_data
  )
  callModule(
    TS_module,
    "productB",
    data = list(lic_data_set_both, mapdata, worldmapdata),
    product = "ProductB",
    prod_group,
    x,
    y,
    show_data
  )
  callModule(
    TS_module,
    "all",
    data = list(lic_data_set_both, mapdata, worldmapdata),
    product = "ALL",
    prod_group,
    x,
    y,
    show_data
  )
}

shinyApp(ui = ui, server = server)
Here is an extract of the Module UI and server piece.
# Module UI -------------------------------------------------------------------

TS_module_UI <- function(id) {
  ns <- NS(id)

  tagList(

    fluidRow(
      box(highchartOutput(ns("product_group"))),
      box(highchartOutput(ns("by_region"))),
      box(highchartOutput(ns("top_10_prod"))),
      box(highchartOutput(ns("top_10_states")))
    )
  )
}

#Module Server ----------------------------------------------------------------------------

TS_module <-
  function(input,
           output,
           session,
           data,
           product,
           prod_group,
           x,
           y,
           show_data) {

    TS_with_year_filtered <- reactive({

      data <- as_tibble(data[[1]])
      get_year <- x()
      get_unit_measure <- y()

      if (prod_group()) {
        data %>%
          filter(between(FY, get_year[1], get_year[2]),
                 `Prod Group` == "SERVER")
      } else {
        data %>% filter(between(FY, get_year[1], get_year[2]))
      }
    })


    TS_with_All_vs_namedProdtype <- reactive({

      if (as.character(product) == "ALL") {
        TS_with_year_filtered()
      } else {
        TS_with_year_filtered() %>%
          filter(Product == as.character(product))
      }
    })


    TS_with_Product <- reactive({
      get_unit_measure <- y()
      Product_data <- TS_with_year_filtered()


      if (as.character(product) == "ALL") {

        Product_data %>%
          group_by_at(.vars = c("FY", "SalesTeam")) %>%
          summarize_at(vars(get_unit_measure), sum)
      } else {
        Product_data %>%
          filter(Product == as.character(product)) %>%
          group_by_at(.vars = c("FY", "SalesTeam")) %>%
          summarize_at(vars(get_unit_measure), sum)
      }
    })


    #Calculate Total YTD data

    TS_YTD_Orders <- reactive({

      TS_with_Product() %>%
        summarise_at(.vars = c(y()), funs(Total = sum)) %>%
        summarise(Total = sum(Total)) %>%
        pull()
    })


    generate_top_10_states <- reactive({
      get_unit_measure <- y()
      TS_state_orders() %>%
        arrange_at(.vars = c(get_unit_measure), desc) %>%
        head(10)

    })

    output$top_10_states <- renderHighchart({

      df <- generate_top_10_states()
      get_unit_measure <- y()

      highchart() %>%
        hc_title(text = "Top 10: Orders_by_state") %>%
        hc_add_series(df,
                      "pie",
                      hcaes("`postal-code`",!!get_unit_measure),
                      name = as.character(get_unit_measure)) %>%
        hc_plotOptions(series = list(
          dataLabels = list(enabled = TRUE, format = '{point.name}: {point.percentage:.1f}%'))) %>%
        hc_exporting(
          enabled = T,
          buttons = list(contextButton = list(
            menuItems = c(
              "downloadPNG",
              "downloadJPEG",
              "separator",
              "downloadCSV",
              "downloadXLS"
            )
          )),
          filename = "Top_10_ordersbystate"
        )
    })
RStudio has quite a few tutorials on Shiny Modules. Joe Cheng’s article on Modularizing Shiny App Code. Other:
Here is a Minimal example on shinyapps.io. Also embedded in the post.


Share this post
Twitter
Google+
Facebook
Reddit
LinkedIn
StumbleUpon
Pinterest
Email