


With the help of 2 R-Ninja Eighth Graders, Tara and Ben who have been R-ing since they were 5th graders, I recently taught Coding in R: Information Visualized class (Feb 23rd - March 2019) to Middle Graders (Grades 6-8) for Saturday Academy, a non-profit organisation. We donated all proceeds from teaching the class to Family Dog Shelter, Portland, OR and Oregon Humane Society, Portland, OR, and we will continue to R for Paws by donating all proceeds from teaching R to animal shelters.
Here’s a brief of what we taught, and I should have the entire class materials posted on github by end of June 2019.
The 3 key objectives of the Coding in R: Information Visualized class:
Objective 1: Understand and Construct data sets using vectors and tibbles:
Type_of_Pets <- c("Freshwater_Fish", "Cat", "Dog", "Bird",
                  "Saltwater fish", "small animal", "Reptile", "Horse")
Number_of_Pets <- c(139.3, 94.2, 89.7, 20.3,
                    18.8, 14, 9.4, 7.6)
Total_Pets <- tibble(Type_of_Pets, Number_of_Pets)

# View Total_Pets
Total_Pets
## # A tibble: 8 x 2
## Type_of_Pets Number_of_Pets
## <chr> <dbl>
## 1 Freshwater_Fish 139.
## 2 Cat 94.2
## 3 Dog 89.7
## 4 Bird 20.3
## 5 Saltwater fish 18.8
## 6 small animal 14
## 7 Reptile 9.4
## 8 Horse 7.6# View the structure of the data. What type of variables do you have?
str(Total_Pets)## Classes 'tbl_df', 'tbl' and 'data.frame': 8 obs. of 2 variables:
## $ Type_of_Pets : chr "Freshwater_Fish" "Cat" "Dog" "Bird" ...
## $ Number_of_Pets: num 139.3 94.2 89.7 20.3 18.8 ...Based on Understanding Objective 1, move to reading local excel/csv/rds files. Data from:
Pet_US_Stats <- readxl::read_excel("~/Documents/sunitakenner/Product_Data/Day2_Pet_Data.xlsx")

#Different ways you can look at data
glimpse(Pet_US_Stats)
## Observations: 32
## Variables: 5
## $ Pet <chr> "Freshwater fish", "Cat", "Dog", "Bird", "…
## $ `Number in Millions` <dbl> 139.3, 94.2, 89.7, 20.3, 18.8, 14.0, 9.4, …
## $ `Households that Own` <dbl> 12.5, 47.1, 60.2, 7.9, 2.5, 6.7, 4.7, 2.6,…
## $ Year_From <dttm> 2017-01-01, 2017-01-01, 2017-01-01, 2017-…
## $ Year_To <dttm> 2018-01-01, 2018-01-01, 2018-01-01, 2018-…skimr::skim(Pet_US_Stats)## Skim summary statistics
## n obs: 32
## n variables: 5
##
## ── Variable type:character ──────────────────────────────────────────────────────────
## variable missing complete n min max empty n_unique
## Pet 0 32 32 3 15 0 9
##
## ── Variable type:numeric ────────────────────────────────────────────────────────────
## variable missing complete n mean sd p0 p25 p50 p75
## Households that Own 0 32 32 16.56 19.6 0.7 4.15 6.4 20.45
## Number in Millions 0 32 32 46.21 46.73 7.5 11 17.15 85.95
## p100 hist
## 60.2 ▇▂▁▁▁▁▁▁
## 151.1 ▇▁▁▁▃▁▁▁
##
## ── Variable type:POSIXct ────────────────────────────────────────────────────────────
## variable missing complete n min max median n_unique
## Year_From 0 32 32 2011-01-01 2017-01-01 2014-01-01 4
## Year_To 0 32 32 2012-01-01 2018-01-01 2015-01-01 4Objective 2: Visualize the dataset using ggplot2
ggplot(Pet_US_Stats) +
  geom_col(mapping = aes(x =Year_From ,
                         y = `Number in Millions`,
                         fill = Pet),
                         position = "dodge") +
  scale_fill_brewer()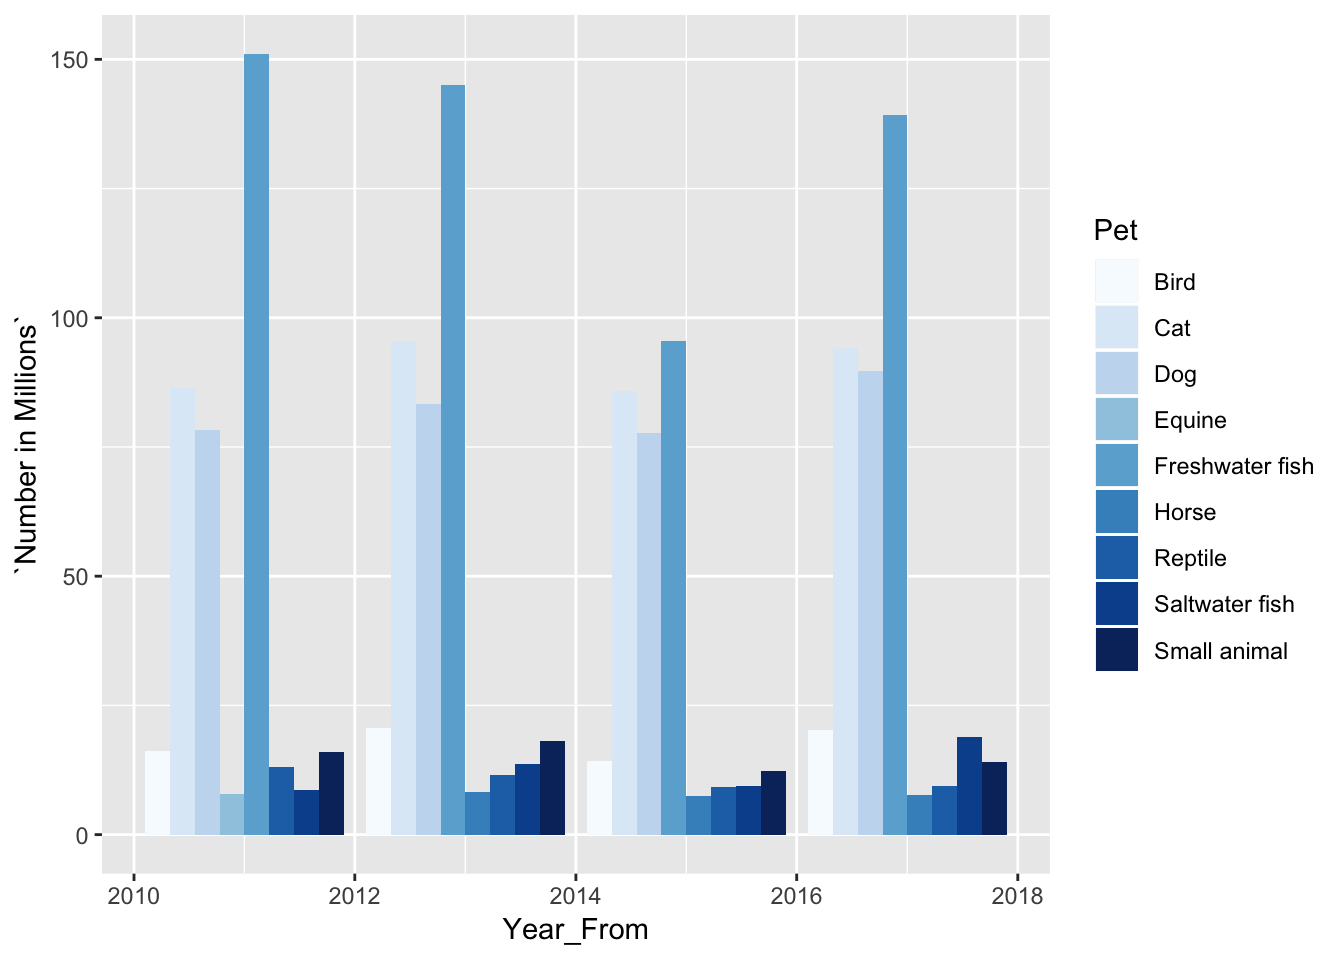
The facet_wrap() power
ggplot(Pet_US_Stats) +
  geom_point(aes(x = Year_From, y = `Number in Millions`, color = Pet)) +
  facet_wrap(~Pet) +
  theme(legend.position = "none")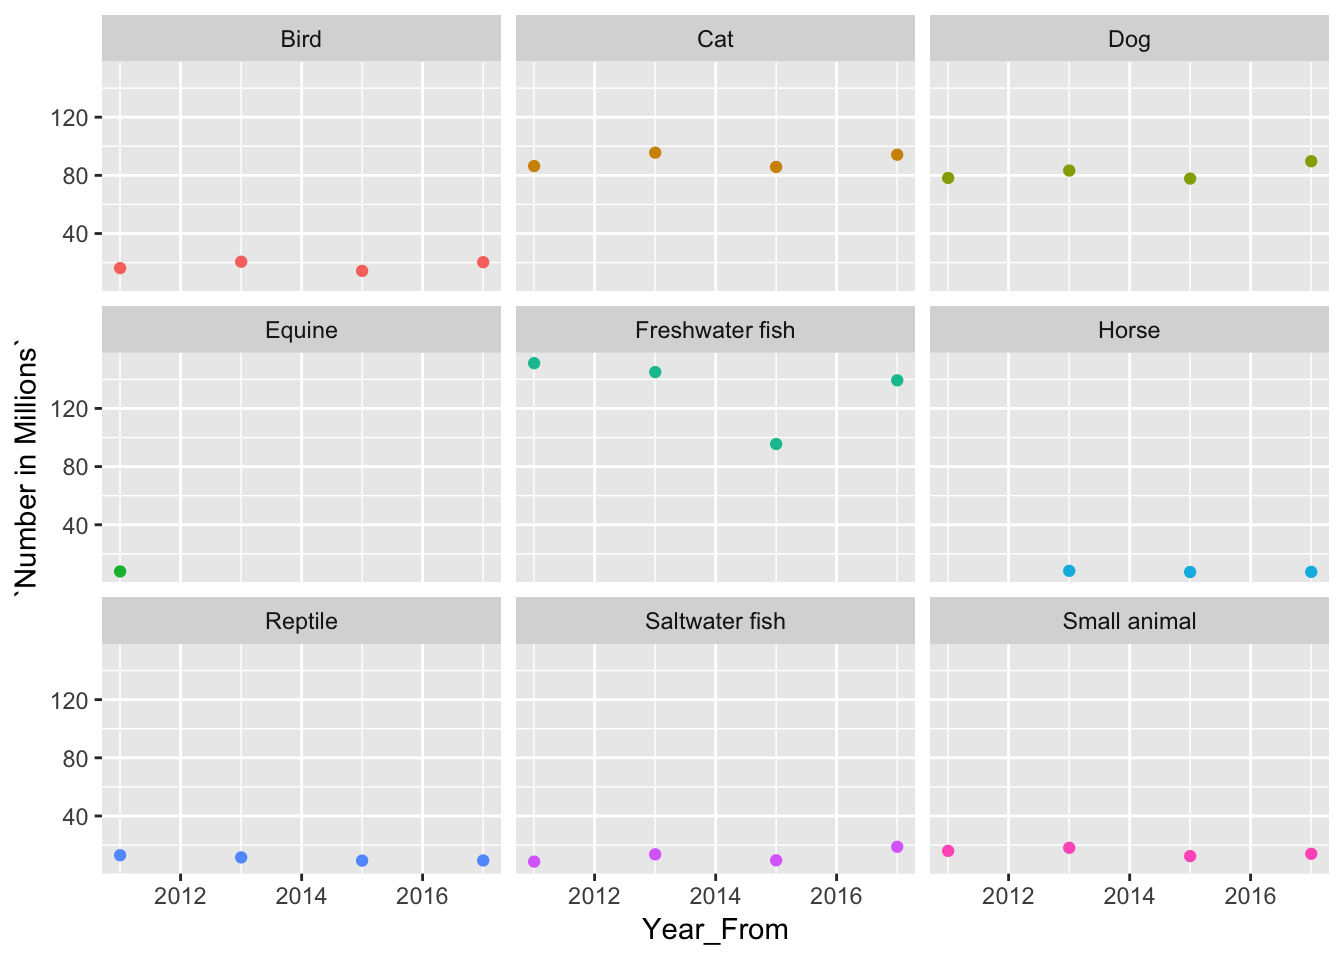
Visualizing median, range: The geom_boxplot() power
ggplot(Pet_US_Stats) +
  geom_boxplot(mapping = aes(x = Pet, y = `Number in Millions`, fill = Pet)) +
  theme(legend.position = "none")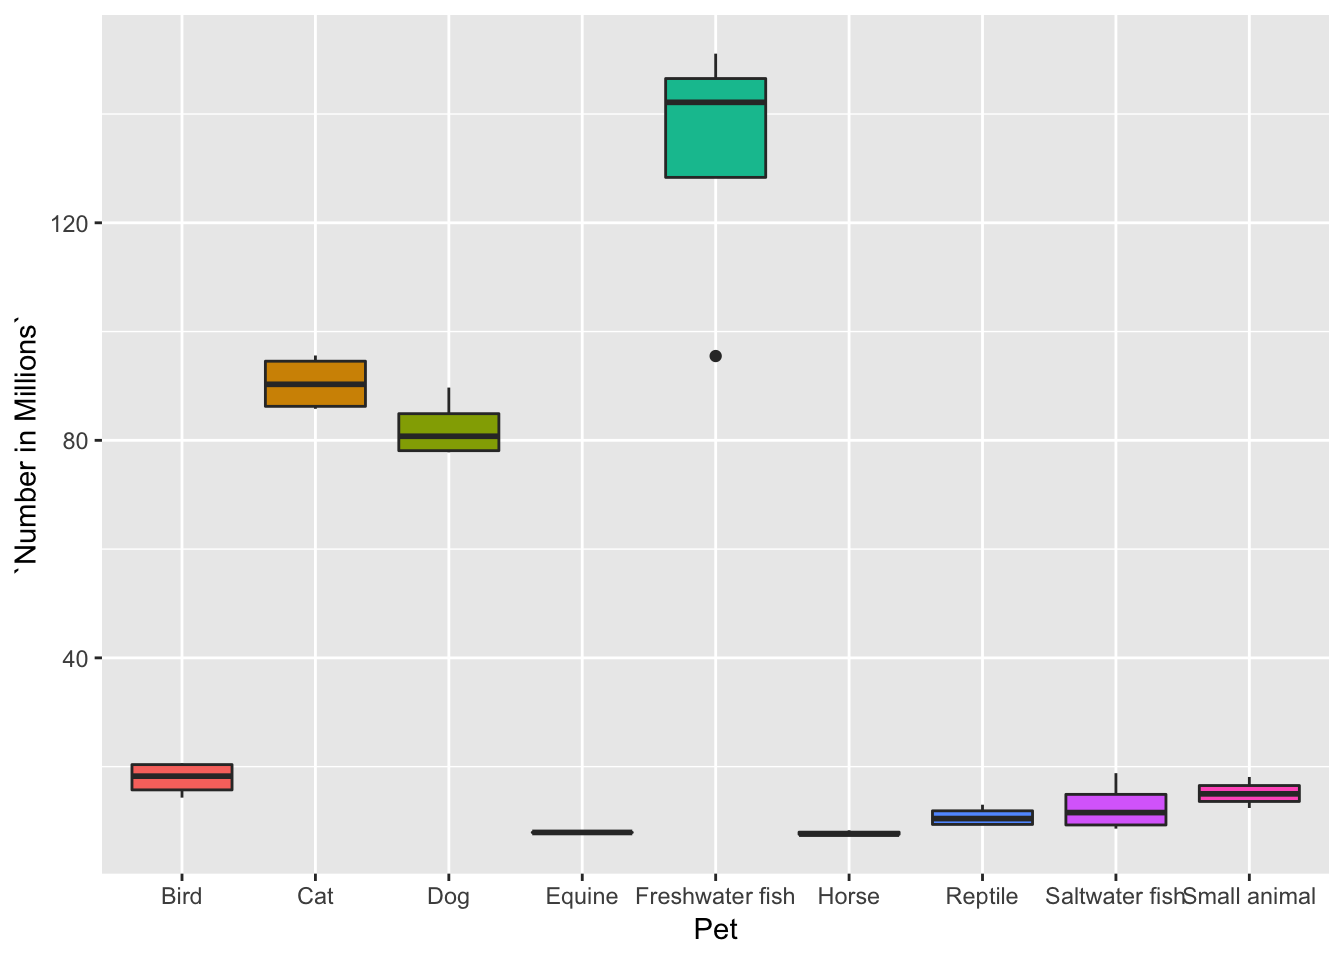
Objective 3: Learn the basics of writing functions in R (mean, median, range)
The middle schoolers who attended this class were well acquainted with the Math for deriving (mean, median, range). Mapping the math to the functions in R as demonstrated below proved to be a fun learning experience for the kids. They loved it (Please see feedback at the end of the post for the class)!!!! Two middle schoolers volunteered to write their own mean and range functions.
The mean function by Martin (A 7th Grader)
#Create a numerical vector of length 5
test_vector <- c(4,5,7,1,6)

#Add the numbers in test_vector
manual_add <- 4+5+7+1+6

#Use R function sum() to add the numbers in test vector
r_sum <- sum(test_vector)

#Count the number of elements in test_vector using R function: length()
count_vectorelts <- length(test_vector)

#Calculate mean: r_sum/count_vectorelts
the_mean <- r_sum/count_vectorelts

#Now translate all the above to a function

myownmean <- function(numbers) {
  meanresult <- sum(numbers)/length(numbers)
  return(meanresult)
}

myownmean(test_vector)
## [1] 4.6# Call function on the Pet Data set
myownmean(Pet_US_Stats$`Number in Millions`)## [1] 46.2125The awesome range function written by Manahil (A 7th grader)
myownrange <- function(numbers) {

  smallest_number <- min(numbers)
  largest_number  <- max(numbers)
  Therange        <- max(numbers) - min(numbers)

  return(Therange)
}

myownrange(test_vector)
## [1] 6# Call function on the Pet Data set
myownrange(Pet_US_Stats$`Number in Millions`)## [1] 143.6Tara and Ben helped out with the median function.
ownmedian <- function(numbervec){

  #First sort the given vector of numbers in ascending order
  sorted_numvec <- sort(numbervec, decreasing = FALSE)

  #Second, find midpoint of the count of numerical vector
  half_length = length(numbervec)/2

  #Second: check if the total length of the numerical vector is even/odd.
  #If even, take the mean of the two mid elements, else take the mid element
  if( length(numbervec)%%2 == 0) {
      median_is = (sorted_numvec[half_length] + sorted_numvec[half_length+1])/2
  }
  else {
    median_is = sorted_numvec[half_length + 1]
  }

  return(median_is)
}

ownmedian(test_vector)
## [1] 5#Call function on the Pet Data set
ownmedian(Pet_US_Stats$`Number in Millions`)## [1] 17.15We are passionate about and love helping all the paws at different shelters!! We will continue to code in R for Paws !!
We’d like to thank Garrett Grolemund @RStudio for all his help in making this class a success, and at RStudio & DataCamp for helping Tara and Ben continue their journey in R with their encouragement and generosity. Thank you!!

Share this post
Twitter
Google+
Facebook
Reddit
LinkedIn
StumbleUpon
Pinterest
Email