
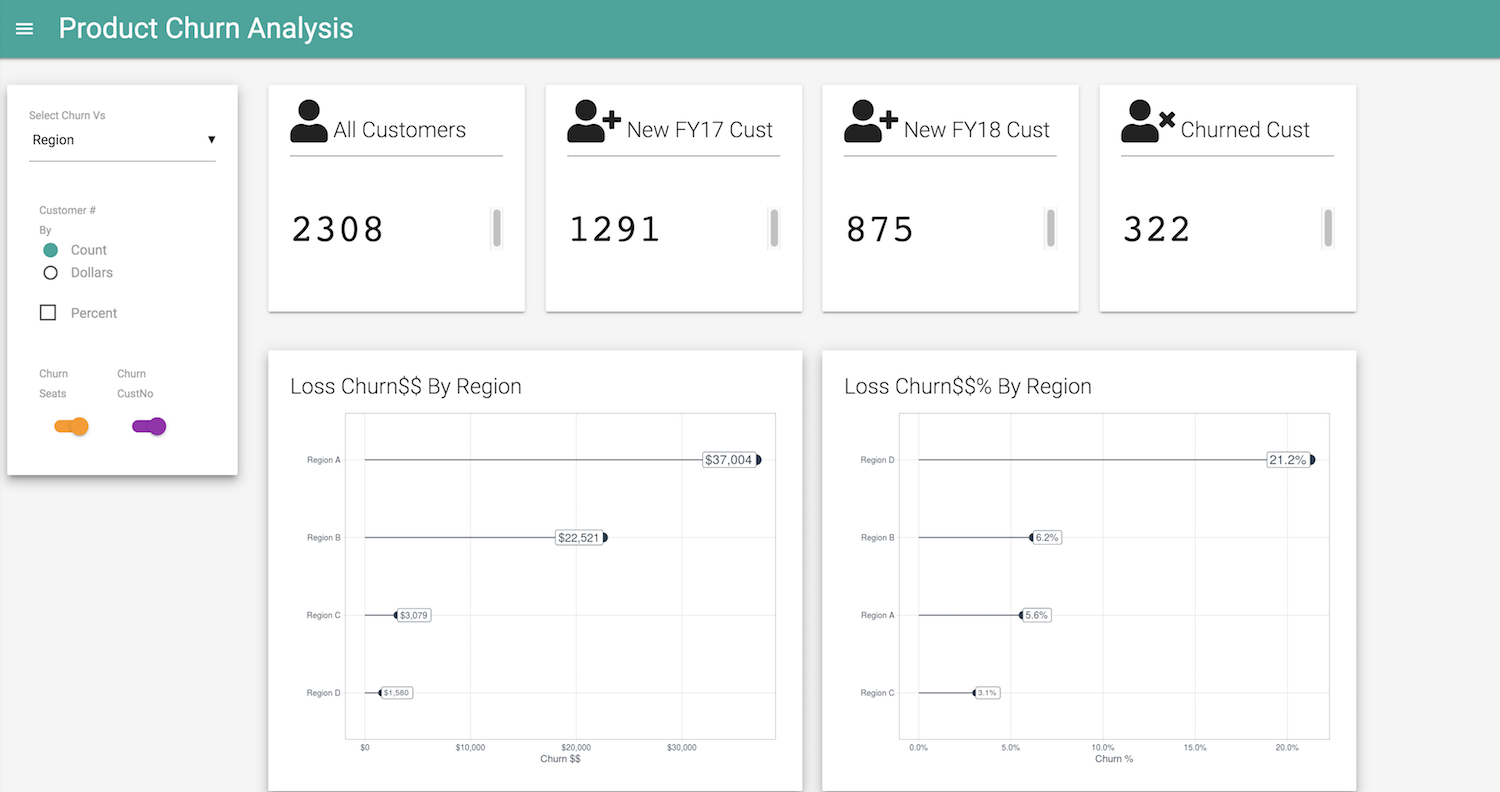
The shinymaterial app built using Eric Andersen’s shinymaterial package is an example of one of the Predictive Churn Analytics projects at work. This is a fantastic package(Thank you Eric) that enables shiny developers like me implement Material Design using R code; more about it here.
There are various online resources that detail solving binary classification problems such as Churn, but the one key resource that maximized my learning and application to a real-world product/s churn problem at work is Matt Dancho’s 10-weeks ROI-Driven Advanced ML Data Science course DS4B 201-R.
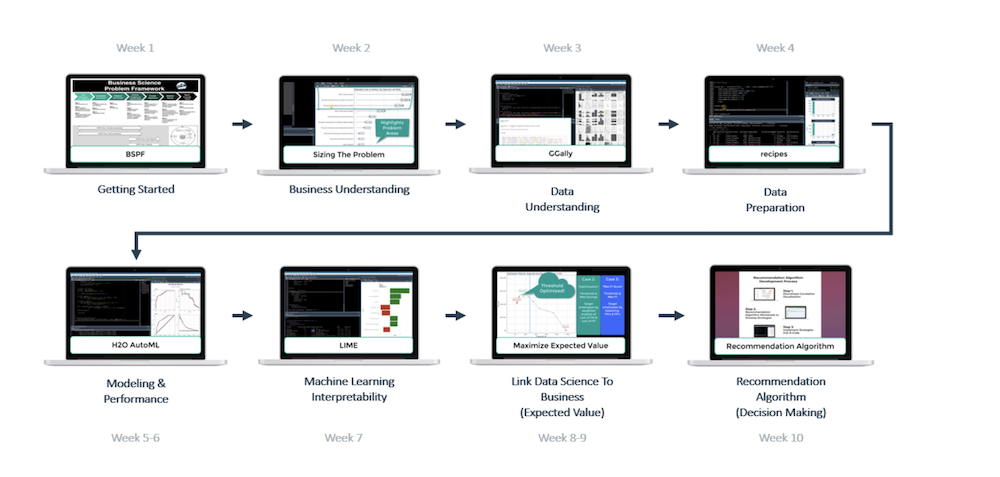
As a sole analytics person that manages the entire data-science workflow, I need a high impact tool-box, given resource, budget and time constraints. Matt Dancho’s Advanced ML course course provides that tool-box (examples: H2o automl algorithms + LIME which provides 30+ models in minutes + explainability that drives business insights, skimr for EDA), and the agile Business Science Problem Framework that provides a roadmap for data science project success.
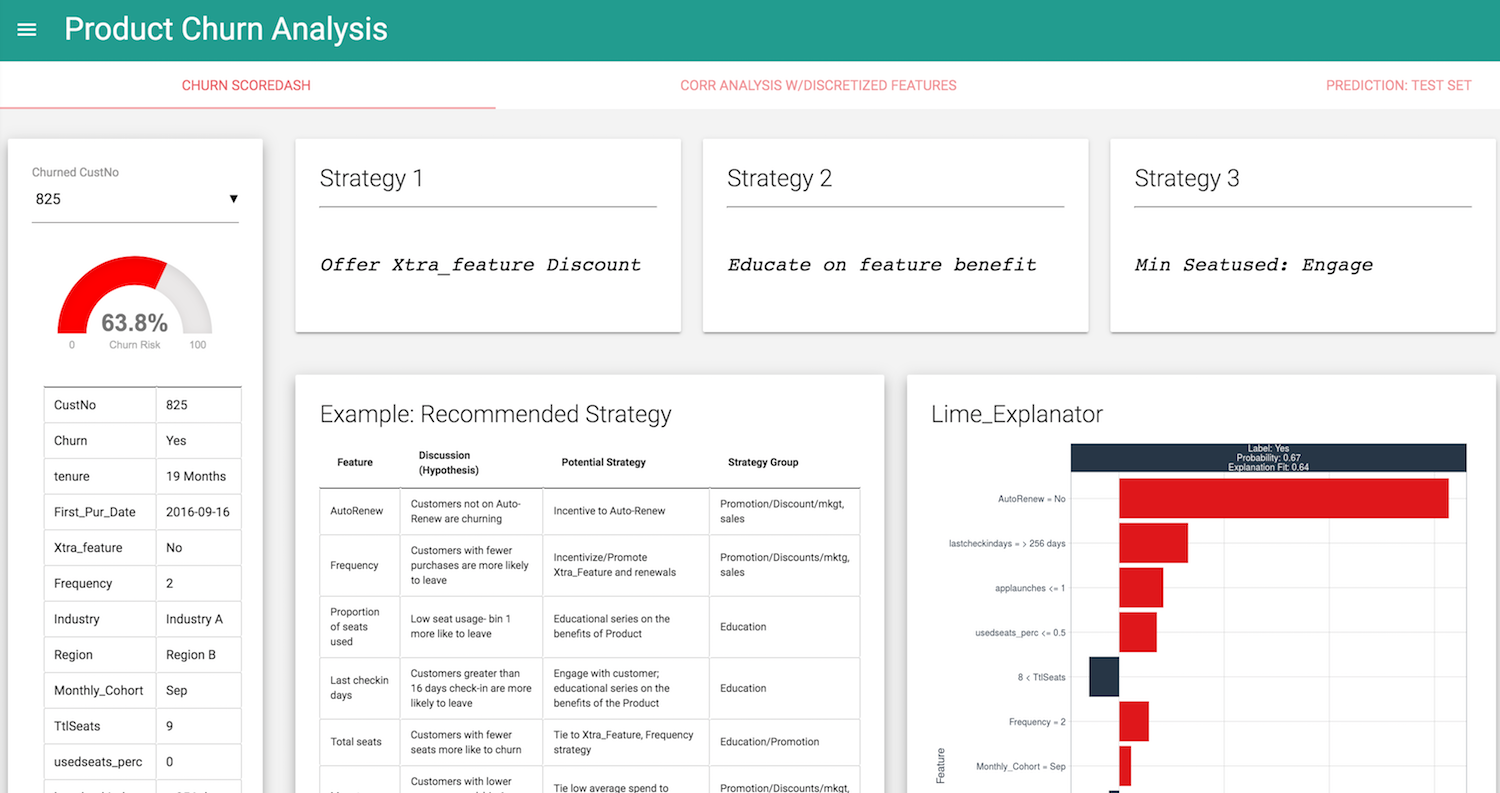
App Example of H2o + LIME = Speed+Power+Explainability
Building the Churn predictive analytics shinymaterial application was fun and I look forward to building more in future. Check out Matt Dancho’s shiny app course.
I’ve included code chunks as examples of actual UI/server pieces of the app.
#
# UI Material Shiny app code for side_nav_tab_content
#

 material_side_nav_tab_content(

    side_nav_tab_id = "churn",

    tags$br(),

    material_row(
      material_column(
        width   = 2,
        material_card(
          title = "",
          depth = 4,
          material_dropdown(
            input_id = "Churn_select",
            label    = "Select Churn Vs",
            choices  = c(
              "Region"           = "Region",
              "Industry"         = "Industry",
              "Xtra_Feature"     = "Xtra_feature",
              "Monthly Cohort"   = "Monthly_Cohort",
              "Auto Renew"       = "AutoRenew",
              "Frequency"        = "Frequency",
              "Recency"          = "Recency",
              "Tenure Days"      = "Tenure_Days_bin",
              "ProductUsage1"    = "Produse1",
              "App Launches"     = "general_app_num_launches",
              "SeatRange Bin"    = "seats_total_bin"
            ),

            selected = "Region"
          ),

          tags$br(),

          material_row(
            material_column(
              width = 5,
              material_radio_button(
                input_id = "churn_metric",
                label    = "Customer # By",
                choices  = c("Count"  = "number",
                            "Dollars" = "dollars")
              )
            )
          ),

          material_row(
            material_column(
              width  = 5,
              offset = 0 ,

              material_checkbox(
                input_id      = "churn_percent",
                label         = "Percent",
                initial_value = FALSE,
                color         = "#4caf50"
              )
            )
          ),

          tags$br(),

          material_row(
            material_column(
              width      = 5,
              material_switch(
                input_id      = "churn_clients",
                label         = "Churn Seats",
                initial_value = TRUE,
                color         = my_col$Churn_Clients)

            ),

            material_column(
              width = 5,
              material_switch(
                input_id      = "churn_customers",
                label         = "Churn CustNo",
                initial_value = TRUE,
                color         = my_col$Churn_Customers)

            )
          )
        )
      ),
More on: Predicting Customer Churn 1

Share this post
Twitter
Google+
Facebook
Reddit
LinkedIn
StumbleUpon
Pinterest
Email